I wrote this feature on 8 April 2010. A lot has changed since then but challenging Mandelbrot remains a Herculean task.
Abstract
Ralph N. Elliott wrote the wave principle in 1938. In 1975 Benoit B Mandelbrot coined the term fractal and in 1982 published his ideas in ‘The Fractal Geometry of Nature’. The book brought fractals into the mainstream of professional and popular mathematics. In February 1999, Benoit Mandelbrot submitted an article to Scientific American called ”A Multifractal Walk down Wall Street.” In the article, he discussed how fractal geometry can be used to model the stock market curves. The enclosed research reworks the Mandelbrot Multifractal from a time cycle rather than trend perspective to prove that time fractal is more proportionate than the price fractal and is the real law of nature, which drives everything in nature. The case is validated by illustrating power-law curves in time cycle periodicities. Power law is seen across nature and in diverse social trends. The power law in prices is a subject of extended study, but there has been no research attempt made to prove power law in time cycle periodicities. Testing cycle periodicity needs large historical data. Long-term time series are difficult to obtain and many emerging markets have seen stock market trading activity only started a decade back. The continued prosperity after the 1980s was a reason why time fractals did not get researchers’ attention, unlike price fractal which was actively studied and researched. Cycles are not conventionally believed to be patterned. Patterns are understood either conventionally or as Elliott wave fractals. Even few Elliott wave practitioners have admitted the limitation of the Elliott Wave structure as being sharper on form than on time. These were a few reasons why time fractals remained unproven. This study further connects its findings with the existing research on various economic cycles finally extending the proof to a long-short Intermarket strategy on an asset pair.
The paper has the following structure.
1: Cycles underlie fractals and Mandelbrot’s multifractals can be redrawn from a cycle perspective. This suggests that time cycles are fractals that showcase self-similarity with a factor of 3. They are also more proportionate than price fractals.
2: The above mathematical proportion X, X/3, X/9, X/27, etc can be seen in the economic group of cycles (Fig. 1) viz. William Strauss and Neil Howe, Brian Berry, Clement Juglar, and Joseph Kitchin, which are connected by 3. This hence is not a chance event, but owing to time fractal nature. This means that if we isolate the Kitchin (K) cycle of 40- 44 months, which is widely witnessed, we could identify lower hierarchies i.e. K/3, K/9, K/27, etc. The cycle characteristics were kept in mind before isolating the K factor.
– – -K/9-K/3-‘K’ KITCHIN-JUGLAR-BERRY-STRAUSS- – – — -K/9-K/3-K-3K-9K- – –

Fig. 1 Economic cycles ruled by a factor of 3.
3: If it is assumed that time fractals can be isolated, similar cycle periodicities can be witnessed and isolated in intermarket ratio lines, which are independent of price.
4: The cycle periodicity was tabulated and tested for power law distributions.
5: The K/9 time fractal periodicities on intermarket ratio line are tested in the long-short strategy.
Time Fractals vs. Price Fractals
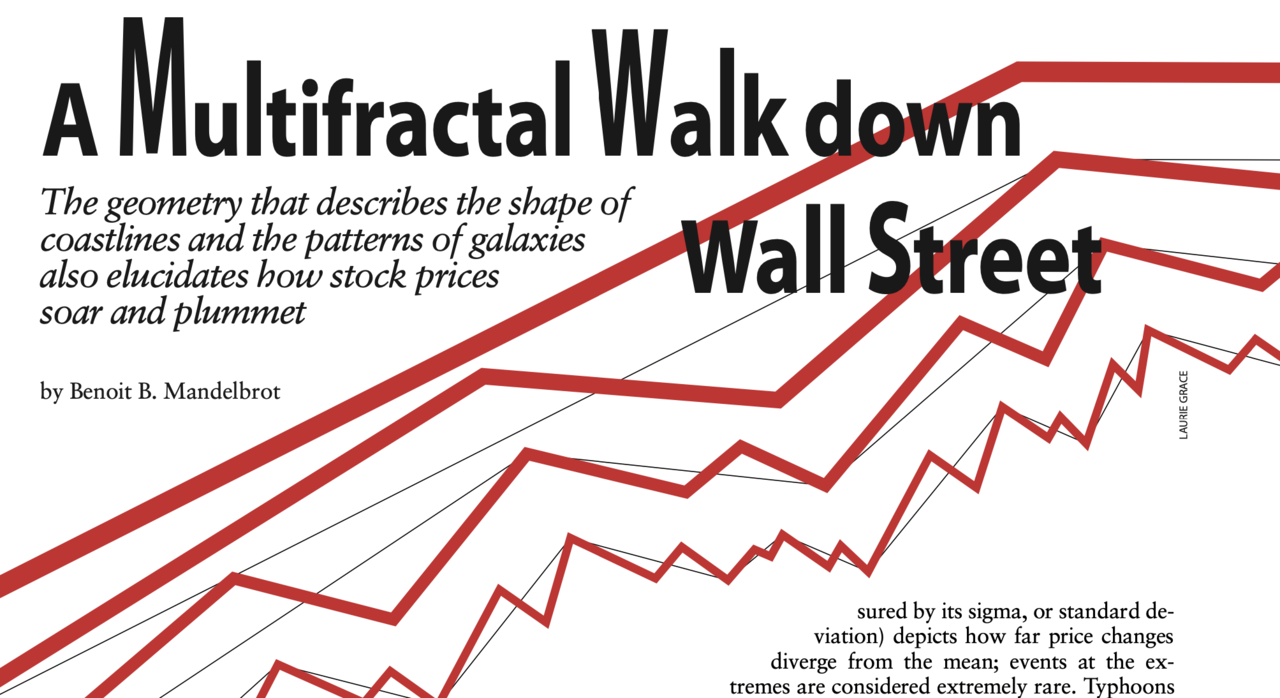
The term fractal, as Mandelbrot defined it, refers to a curve in which distinct parts are smaller scales of the whole curve. A multifractal is formed by a curve pattern being repeated at smaller and smaller time scales. Mandelbrot used a 3 wave pattern, the first and last being in the direction of the general trend, the middle against the general trend. A picture of his example from the article “A Multifractal Walk Down Wall Street” is illustrated in Fig 2. Mandelbrot multifractals focused on the price and not the time. This is the reason why price fractals and time fractals seem disconnected. Human beings as a society can relate more to what they can see and feel. Time is an underlying variable, which is tougher to relate compared to price. This is one reason why the debate regarding who saw it first, Elliott or Mandelbrot is inappropriate when one realizes that time fractals are more proportionate than price fractals. If one redraws Mandelbrot’s multifractals from a time cycle (The up leg and the down leg) rather than from a price trend (The up leg – The down leg – The up leg) perspective, the same multifractals emerge out as time fractals Fig 3. Not only do the iterations break up in the same proportion X, X/3, X/9, X/27, etc., but the time fractals also are more homogeneous than the price multifractals in Fig.2.

The Kitchin Cycle (The K Factor)
Tony Plummer in his book ‘Forecasting financial markets’ does give reference to time cycles as a triad of patterns. Though Plummer comes close to the idea of a power law and self-similarity in cycles, he does not
give proof, for the same. He mentions that “if the triad theory is correct, then the pattern should repeat themselves in a fractal-like fashion across all genuine cyclical time”. Plummer also talks about the time aspect of the cycle along with the cycle pattern (Fig.4). The cycle pattern is represented by the move from 0 to C i.e., 1–2–3 up and A–B–C down. It then consists of three lower-level (sub-) cycles, each of which itself contains the archetypal six-wave pattern. According to Plummer each of these lower-level cycles will itself consist of three cycles. In other words, the cycles are nested within each other. In all cases, significant lows can be expected to occur one-third and two-thirds along the time elapse of the next higher cycle that contains it. Similarly, important highs occur at one-sixth, one-half, and five-sixths along the time elapse of that higher-level cycle.

Fig. 4 Tony Plummer’s triad pattern
In 1923, Joseph Kitchin reported a short-term, three- to five-year, business cycle. There is a huge amount of evidence that the central periodicity of the short-term Kitchin cycle is somewhere between 40 and 44 months that is, somewhere between 3.33 and 3.67 years. These periodicities can be found in prices.
So if now the X factor witnessed from time fractals (derived from redrawing Mandelbrot’s multifractals) is replaced with the K cycle factor, which is widely seen and accepted, then the K factor should subdivide in a similar proportion as the X factor (X. X/3, X/9, X/27, etc.). The K factor should be seen across assets and across any time series irrespective of the Y-axis. Lack of long-term data and the need for a workable investment strategy was another reason why the K cycle was chosen as a workable time frame to break down. Moreover, economic cycles research did not go below Kitchin, the very reason this study focused on the sub-K level. The rate of change oscillator (ROC) was used to illustrate the K cycle and the other K factors.
Isolating the K Factor
Cycle Translation and Pattern Distortion
Cycles are about pattern and periodicity. The pattern is the stronger of the two-cycle characters. The focus was on identifying self-similar nesting structures (Fig. 5), three smaller cycles nesting under the larger cycle. Care was taken to identify cycle pattern distortions (Fig. 7), to illustrate potential improper cycle isolation and identification. Just like price fractals, smaller time fractals are influenced by larger time fractals which drive them. Cycles see a shift in the idealized peaks referred to as translation (Fig. 6).

Fig. 5 Cycle hierarchy
Once cycles have been properly categorized in the K factor and sub K factors, the cycle periodicities can be used for forecasting purposes.

Fig. 6 Cycle translation

Intermarket Strategy
Easier access to information has increased interest in global assets and instruments. On one side this lead to a rise in trading volumes, but at the same time made market relationships harder to understand. Intermarket analysis coined by John Murphy has increasing relevance in these times. The subject’s main hypothesis is that technical analysts need to broaden their chart focus to consider respective Intermarket correlations. Analysis of the stock market, for example, without consideration of existing trends in the dollar, bond, and commodity markets, is simply incomplete. Murphy suggests that financial markets can be used as a leading indicator of other markets and, at times, confirming indicators of related markets.
The current study tested time fractals on the Intermarket ratio between two assets, especially because they worked independent of price and were a good proxy to demonstrate the fractal nature of time. Murphy’s Intermarket analysis also illustrated the nature of performance cyclicality irrespective of the Intermarket ratio between two asset prices. Murphy talked about cyclicality between large asset classes like commodities and equities, which are the larger K time fractal factors under action.
However, Intermarket analysis (Fig. 8) owing to its focus on trend over time, just like the Elliott Wave Theory, fails to quantify the time element in the investment approach. The perspective signals mentioned in Murphy’s Intermarket analysis rely on conventional tools like breaking of a trendline and indicative patterns on the Intermarket ratios.
Fig. 8 depicts the price of asset A, asset B and the ratio between them. The K factor is identified from the respective ratio line. This addition of the time fractal to the Intermarket ratio line gives the Intermarket strategy. (Fig .9)

Power Law Similarity
A power law is a mathematical formula that states that as a phenomenon increases in scale it decreases in frequency. Similarly, time cycles reduce in number as the time scale increase (K/9 to K/3 to K). Power laws appear widely in physics, biology, earth, and planetary sciences, economics and finance, computer science, demography, and the social sciences. For instance, the distributions of the sizes of cities, earthquakes, solar flares, moon craters, wars, and people’s fortunes, stock indices, and prices all appear to follow power laws.
A power-law distribution is sometimes called a scale-free distribution because it is the only distribution that remains the same irrespective of the scale. The term is referred to as scale invariance. A closely related concept to scale invariance is self-similarity. In mathematics, a self-similar object is exactly or approximately similar to a part of itself (i.e. K= 3*K/3). The whole has the same shape as one or more of the parts. Self-similarity means that any magnification would lead to a smaller piece of the object that is similar to the whole, for example, coastlines are statistically self-similar with all parts of them showing the same statistical properties at many scales. This is a typical property of fractals and appears in time cycles, as a large cycle encompasses smaller cycles, which in turn have smaller cycles nesting under them.

Fig. 10 Power law distribution
The power law can be described as…P(x)= cx-α
Here α is the scaling exponent. The distribution is an exponential function, which takes a straight line form on a logarithmic scale. lnP(x)=lnc-αlnx
Formally, this sharing of dynamics is referred to as universality, and systems with precisely the same critical exponents are said to belong to the same universality class. Working on the assumptions that time cycles belonged to the same universality class and were self-similar fractals, the k factor Intermarket ratio cycle periodicities were pulled out to test for a power-law distribution.
The K Tree
Several emerging market index pairs and top Dow Jones components were paired to isolate the K factor for cycle periodicities. Self-similarity appeared in most cases. About 3 Kitchin cycles, nearing a decade of daily data were tested for the study. The following three Intermarket ratio lines were studied.
BRENT vs. WTM (Brent vs. Midland)
GE vs. CAT (General Electric vs. Caterpillar)
XOM vs. CVX (Exxon vs. Chevron)
The above pairs were purposely chosen owing to their high and poor correlation. BRT-WTM correlation was 0.99, XOM-CVX correlation was 0.97, and GE – CAT correlation was at 0.12 for the period under study. All of the pair cycle periodicities depicted the underlying K factor hierarchy.

Fig.11- Ktree
Intermarket Strategy
The strategy has three parts. First, there is a visual of three iterations of the K factor on the Intermarket ratio line (Fig. 12, Fig. 14, Fig. 16).
The second part includes the distribution and tabulation of the time cycle periodicity of the respective pair.
The tables (Table 1, Table 3, Table 5) carry the periodicities in days in column A. The calculations for B and C are enclosed.
B = Periodicity in days*STDEV + Mean C = NORMDIST (B,STDEV, MEAN, FALSE)
Where STDEV is standard deviation and NORMDIST is the normal distribution functions.
The third part (Table 2, Table 4, Table 6) is the working of the long-short strategy, where a long trade on numerator asset A of the Intermarket ratio is executed while simultaneously the denominator B from the pair is shorted. The entry number of days is the same as the time cycle periodicities carried on the second part of each working. The exit number of days is taken as half of the K/9 cycle. The strategies are tested for an average of 3 Kitchin cycles. Underlying spot prices on the two assets making the pair are used. There is a stop factor of 10% put to see how many times the pairs lose more than 10%. The strategy assumes a leverage factor of 1. The last column is the net annualized returns.
A few important aspects linked with time fractals-based strategies is that the fractal illustrates the performance cyclicality clearly. For example, the GE-CAT conventionally showcased a secular underperformance of GE against CAT for the period under study. However, despite such an underperformance of GE against CAT, the K factor allowed us to trade long GE vs. Short CAT strategy successfully over the K/9 time frame (102-131 days) with exits on an average of 54 days. The other two pairs viz. BRT-WTM and XOM-CVX are highly correlated pairs that are not easy to trade from a conventional pair strategy. The time fractals-based Intermarket strategy delivers consistent returns on both pairs. This proves that a conventional underperformer or highly correlated assets can be traded against its sector leader (performer) or sector peers respectively if the time fractal is isolated well. The findings of the strategy reinforce the idea that time fractal is better than the price fractal.
All three pair cycle periodicities show power-law distributions.
The average entry number of days for the three pairs were 111, 102, 131 for GE-CAT, BRT-WTM, and XOM-CVX respectively. The exit number of days for the three pairs were 54, 50, and 66 in the same order. The stop loss of 10% was hit twice in 80 readings, once on both GE-CAT and XOM-CVX pairs. The average annualized non-leveraged return was at 54%.

Fig. 12 – GE VS CAT intermarket ratio line vs. the K factor

Table 1 – GE vs. CAT cycle periodicity distribution calculation

Table 2 – GE vs. CAT long short pair strategy
Conclusion
The proof of the superiority of the time fractal over the price fractal emerges when Mandelbrot’s multifractals are redrawn from a cycle perspective. The time fractal Intermarket ratio periodicities are put to test for power law and as an investment strategy. The K factor indicator assists in this process. The strategy on the high and low correlated pairs showcases the performance cyclicality over the K/9 factor time frame. All pairs under study return positive gains. The idea introduced first time in the current research redefines the long-short technique as a time fractal trading technique, which can be used by fund managers across different assets and time frames, aggressively or passively by altering the K factor. The study has assumed no leverage but real market leverage can change the risk and return profile for the same. Overall time fractals is a subject that traverses beyond capital market forecasting and can be utilized in various areas of scientific research.
Bibliography
- Ralph N. Elliott, Nature’s Laws: The Secret of the Universe, 1946
- Benoit B. Mandelbrot, The Fractal Geometry of Nature, 1982
- John Murphy, Intermarket Analysis, 2005
- Tony Plummer, Forecasting Financial Markets: Technical Analysis and the Dynamics of Price, 1998