
AlphaBlock’s “open indexing” is a systematic, scientific, and replicable method, which is based on a mathematical innovation [1][2][3][4][5][6][7][8][9][10] that allows for the construction of smart beta portfolios that are less concentrated, recover faster after a market fall and improve on the limitations of the current indexing methods [11][12][13]. The Exceptional & Rich [E&R] Indices Sandbox is a codebase that executes the following three steps. First; downloads yahoo EOD [end of day] closing price data. Second; generates rankings. Third; creates portfolios using these rankings. The portfolios are not rebalanced and are held for 3 holding periods [1, 2, and 3 years].
The method tests the following statistical factors. Value – if ranking is equal or below 20 i.e. bottom quintile [V]. Core – if ranking is between 20 and 80 i.e. rest quintiles ignoring top and bottom quintile [C]. Growth – if ranking is equal or above 80 i.e. top quintile [G]. The following types of portfolios are generated: Value [V], Core [C], Growth [G], Value Growth i.e. top and bottom quintile [VG], All quintiles [VCG]. Based on this data the following files are created: Summary Table, Index Drawdown, Index Draw Down Curve plot, and Daily Return. If the input type is All [VCG] the code will generate an unequal weighted portfolio with value and growth having 40% each and core only 20%. All other types of portfolios are equal weighted.
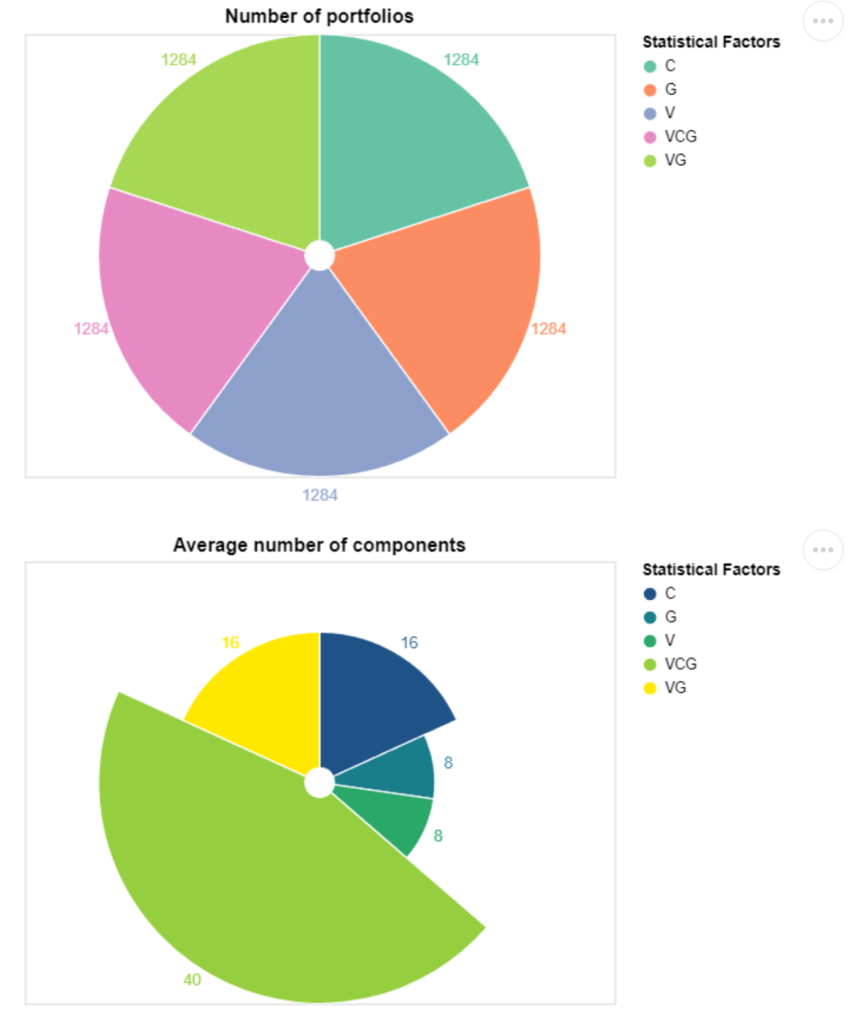
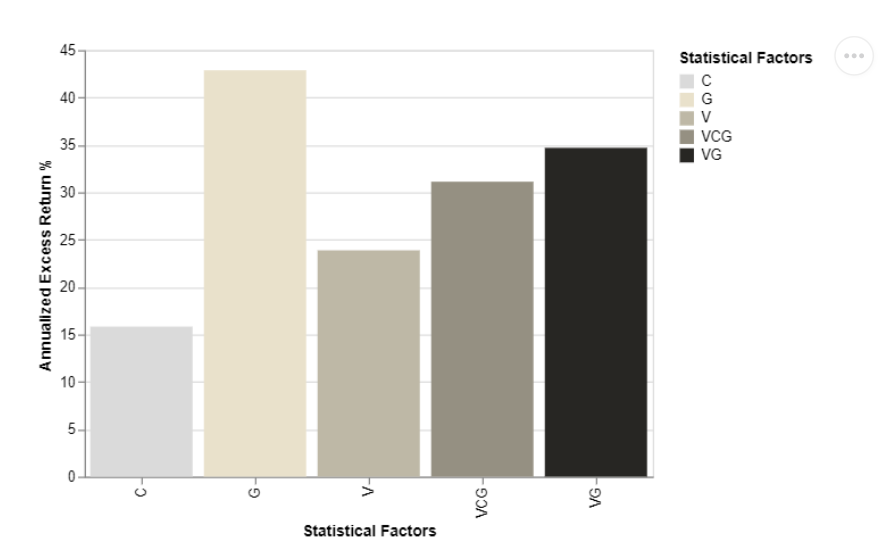
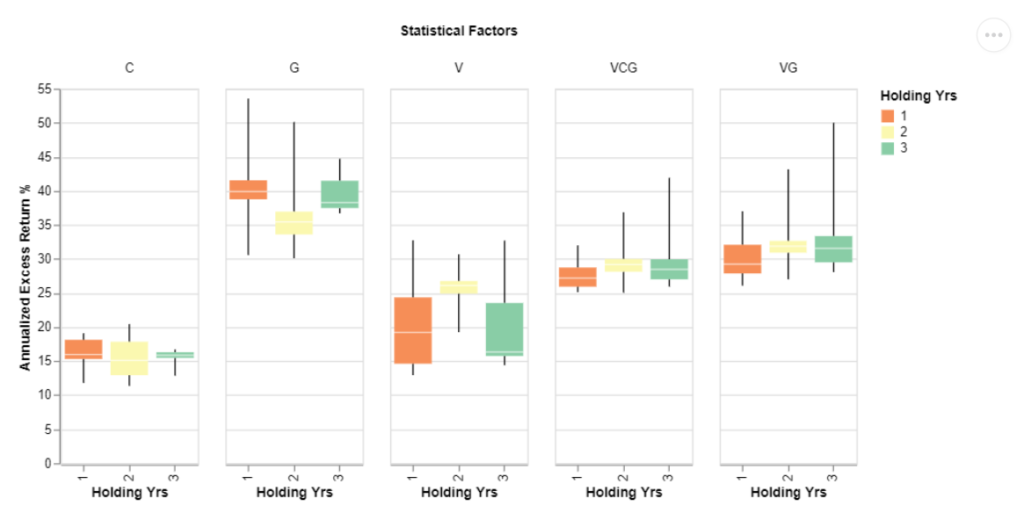
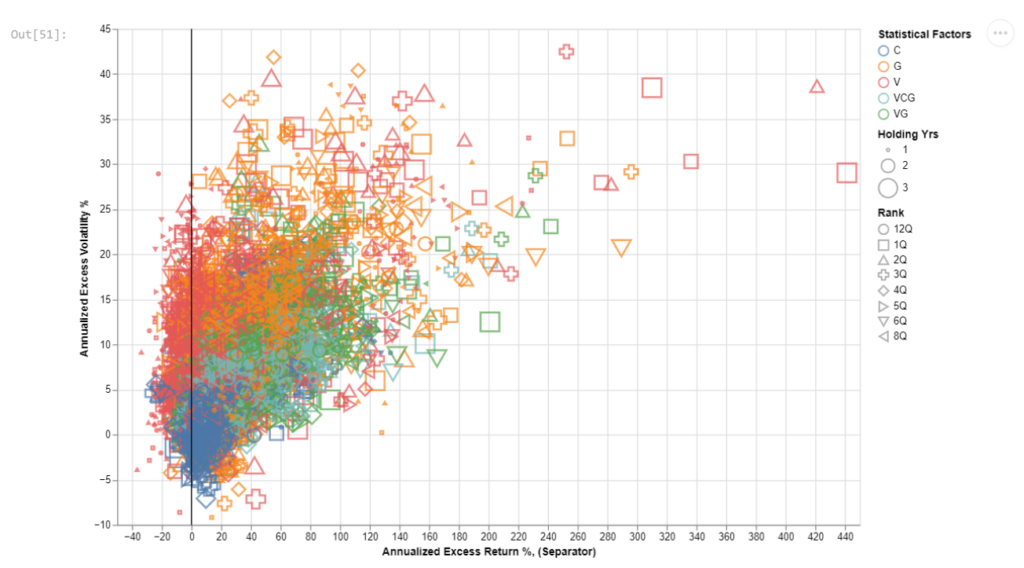
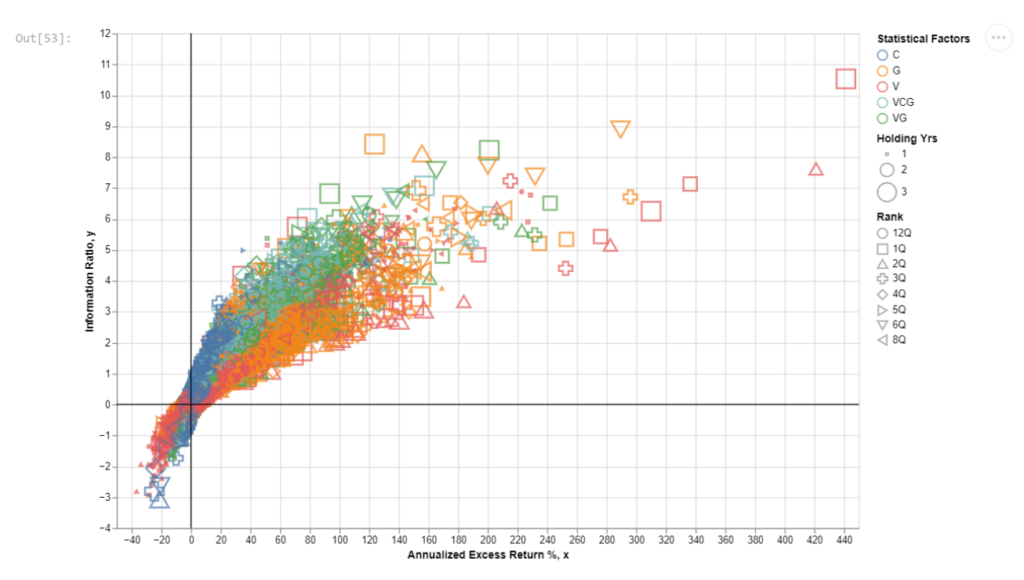
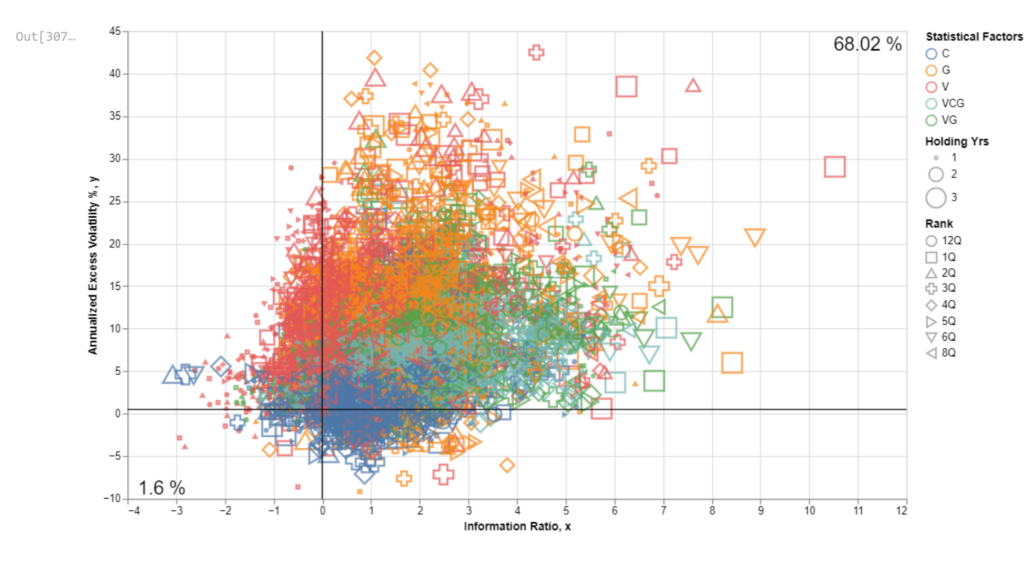
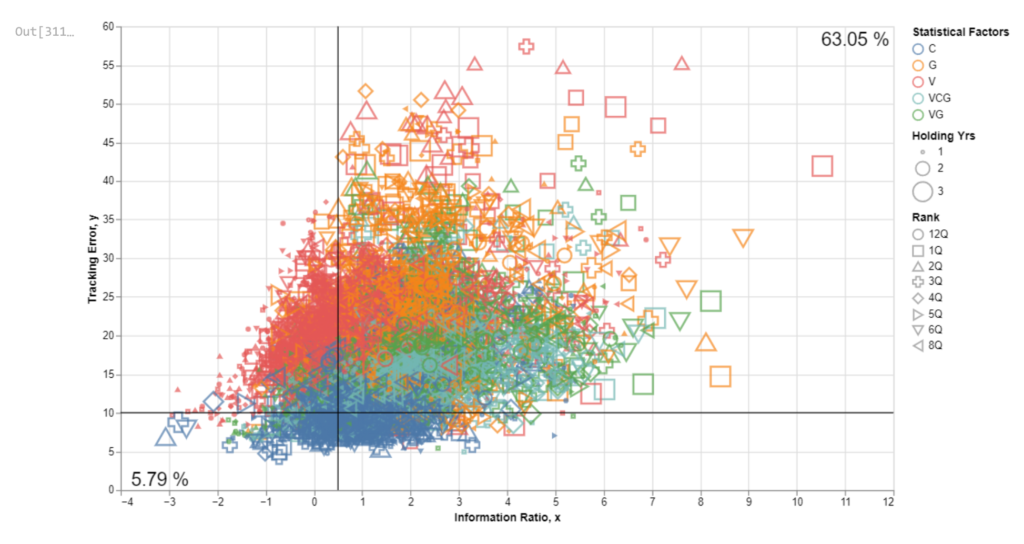
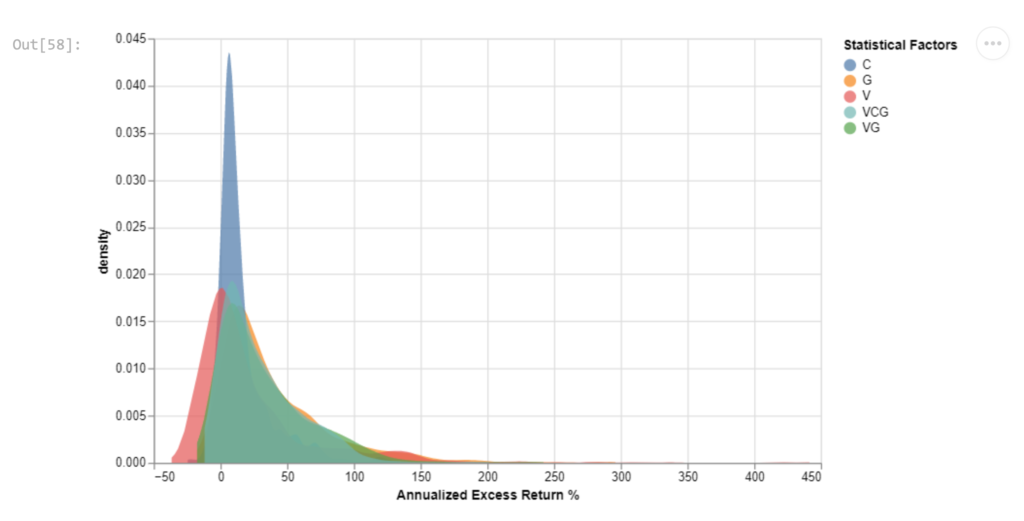
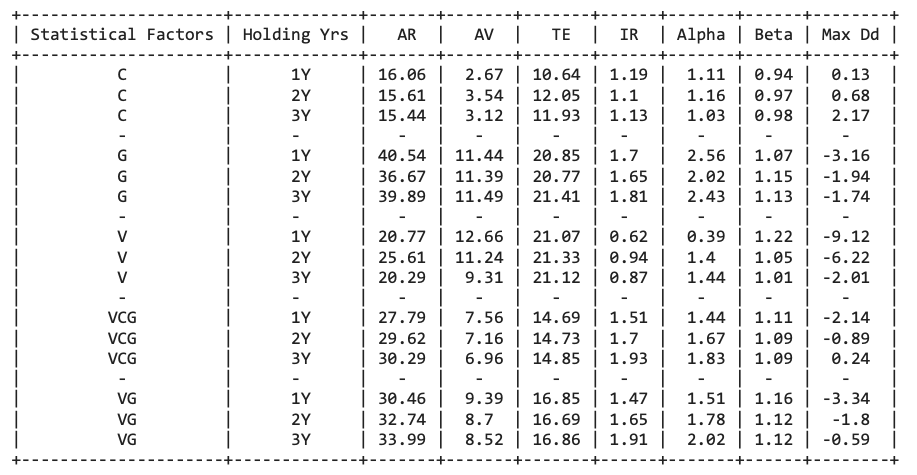
Exceptional & Rich BSE 40 consists of the 40 large cap equity in India. The sandbox studies the following factor portfolios. The VCG 40, G 8, V 8, VG 16, and C 24. The benchmark for the group is BSE 100 i.e. India’s top 100 large-cap equity. 6420 simulations were run. On average, the factor models delivered an annualized excess return from 15% to 40% for the study period of 6 years since 2016. G 8 was the top performer across different periods and rankings. G, VCG, and VG had the highest Annualized Excess Returns and highest Information Ratios among the five factors with Tracking Errors in the range of 14% to 20%. VCG and C had the least Tracking Error, while V 8 had the least Information Ratio among all the factors. The sandbox continued to highlight the poor performance of Value [V], the neutrality of Core [C], and the superior risk-return tradeoff with Growth [G], Value Growth [VG], and the Value Core Growth [VCG] method. The VCG had the highest number of components among all the factors and hence was the best overall factor model to compare with the benchmark.
Input Data

Annualized Excess Returns Across Statistical Factors
Quartile Distribution of Annualized Excess Returns vs. Holding Yrs
Annualized Excess Returns vs. Annualized Excess Volatility
Annualized Excess Returns vs. Information Ratio
Information Ratio vs. Annualized Excess Volatility
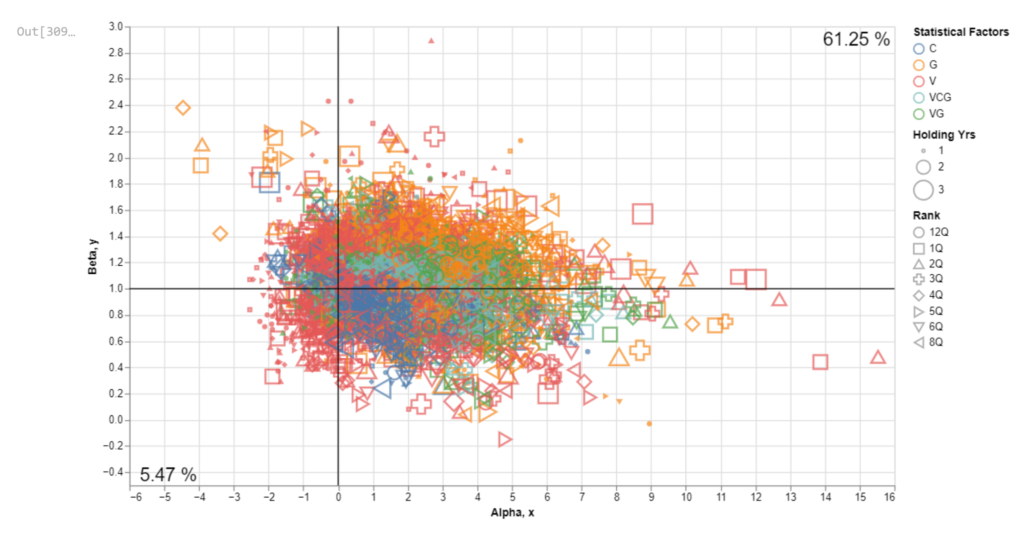
Beta vs. Alpha
Information Ratio vs. Tracking Error
Annualized Excess Returns Distributions
Modern Portfolio Theory Statistics
AR – Annualized Excess Return, AV – Annualized Excess Volatility, TE – Tracking Error, IR – Information Ratio, Max Dd – Max Drawdown
Bibliography
[1] M. Pal, Mean Reversion Framework, SSRN, May 2015
[2] M. Pal, Markov and the Mean Reversion Framework, SSRN, May 2015
[3] M. Pal, How Physics Solved your wealth problem, SSRN, October 2016
[4] M. Pal, The Beta Maths, SSRN, March 2017
[5] M. Pal, [3N] model of life, SSRN, April 2021
[6] M. Pal, The Snowball Effect, SSRN, July 2022
[7] M. Pal, Momentum and Reversion, August 2015
[8] M. Pal, M. Ferent, Stock Market Stationarity, SSRN, September 2015
[9] M. Pal, Reversion Diversion Hypothesis, SSRN, November 2015
[10] M. Pal, M. Shah, A. Mitroi, Temporal Changes in Shiller’s Exuberance Data, SSRN, February 2011
[11] M. Pal, The S&P 500 Myth, SSRN, July 2022
[12] M. Pal, The Size Proxy, August 2017
[13] M. Pal, Human AI, SSRN, July 2017
Download the complete report from AlphaBlock’s Sandbox on Github.
